The recent volatility in the financial markets has caused the trading range of many currency pairs to widen to levels that we haven’t seen in years. It is important to realise that in these current market environments a 50-pip stop may be just as likely to be hit as a 20-pip stop 6 months ago. For traders that may be looking for technically based stops that are suitable for the current market environment, ATR can be a very useful tool.
Average True Range (ATR)
The Average True Range (ATR) index was introduced by J. Welles Wilder in 1978 and it measures the volatility of a currency pair in the case over a given
period of time.
The “true range” is the greatest of the following:
- Current High minus Current Low
- Current High minus Previous Close
- Current Low minus Previous Close
The standard ATR setting is 14, which means that it calculates the average of the “true range” over the past 14 periods.
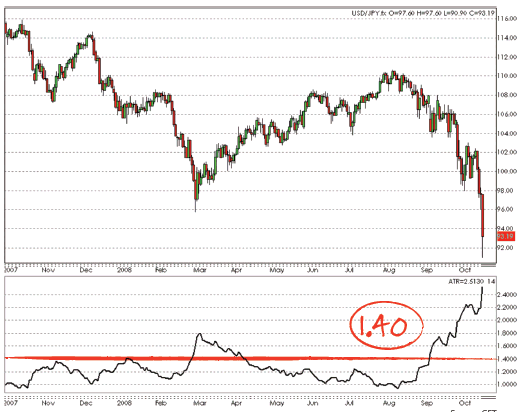
In the USD/JPY chart (bottom), you can see that over the past 12 months (Oct 2007 to Oct 2008), the ATR for USD/JPY has rarely gone over 1.40. However in September, not only did the ATR break above that level, but it reached as high as 2.5. This indicates that the average trading range for the currency pair has more than doubled! Therefore for technically oriented traders, stops may need to be adjusted accordingly.

Note: You can see that over the past 12 months, the ATR for USD/JPY has rarely gone over 1.40. However in September, not only did the ATR break above that level, but it reached as high as 2.5. The ATR has doubled for this pair.
Short-Term vs. Long-Term Trading
In taking a look at the ATR of many currency pairs, traders may start to realise that the daily range has become so wide for some pairs that long-term trading becomes very difficult. The trend may be clear, but a reasonable and logical stop may not. For example, in October 2008, there were many times that GBP/JPY’s daily range exceeded 1,000 pips.
For this reason, it may be more fruitful to look for shorter-term trading opportunities in the direction of the trend.
As indicated earlier, Bollinger bands and ADX are useful tools to help gauge whether the market is in trend or range.
Material published courtesy of GFT


Leave a Comment