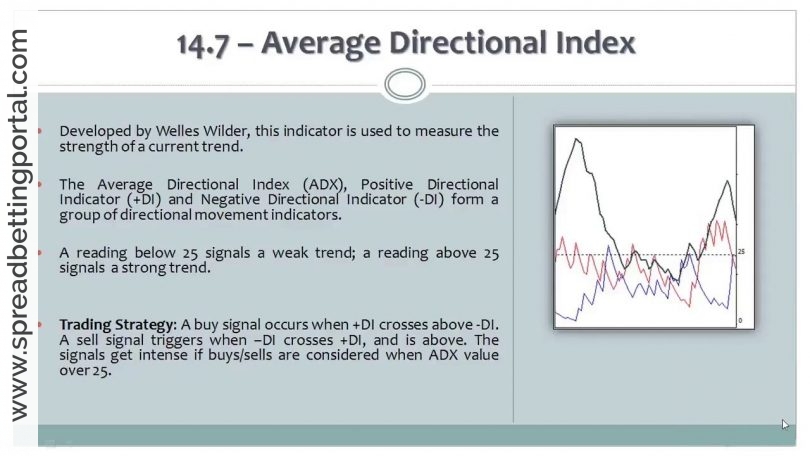
The Average Directional Index (ADX) is a classic measure of a trend’s strength. Unlike Bollinger Bands and Moving Averages which can help define the direction of the trend, the ADX simply measures whether the trend is strong or weak. The index is displayed as an oscillator in a separate box below the price chart on a scale of 0 to 100.
As a rule of thumb, if the ADX is greater than 30 a trend is strong but if ADX is below 20, a trend is weak. In a strong trend, we want to see the ADX sloping upwards.
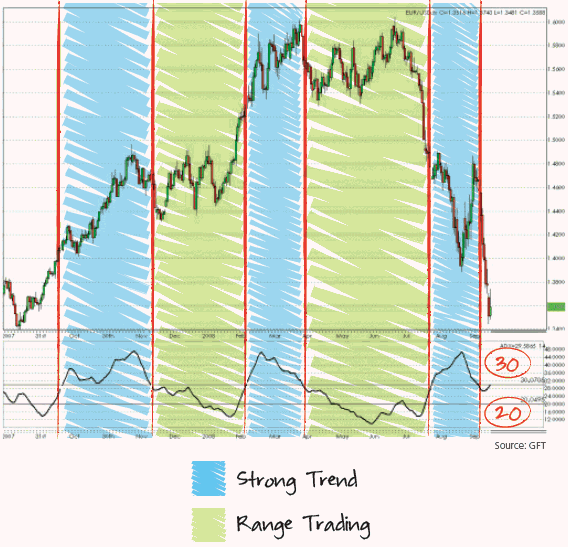
In the EUR/USD chart on the left, we inserted vertical lines to represent the times when the ADX crosses the 30 mark.
Back in March of 2008 for example, the ADX crossed above the 30 mark when the currency pair was trading at 1.52. Over the next month, the currency pair gained strength at a relatively rapid pace and ended up hitting a high above 1.60. When the ADX crossed back below the 30 mark, the currency pair ended up range trading for the next few months before breaking lower in the middle of July.

Note: Shaded lines were inserted to represent the times when ADX crossed the 30 mark.
Material published courtesy of GFT


Leave a Comment